Written by Anatoly Karlin; Originally appeared at The Unz Review
Last year’s summary: Russian Demographics in 2018 [2016; 2014].
Preliminary data for 2018 is in.
Summary
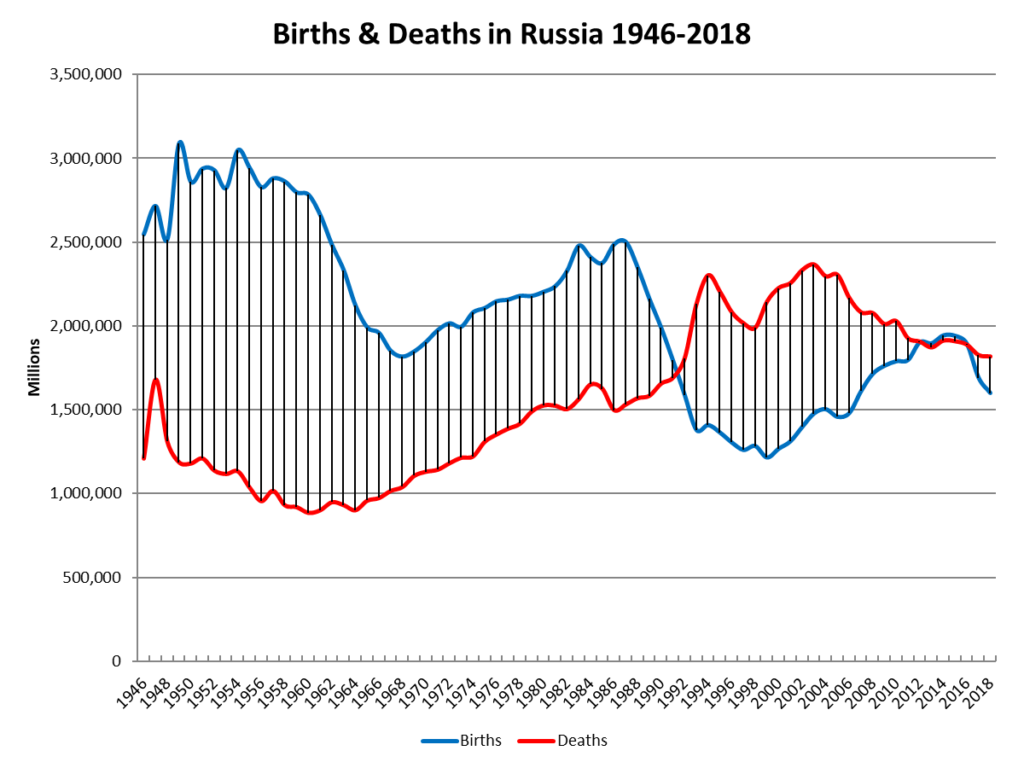
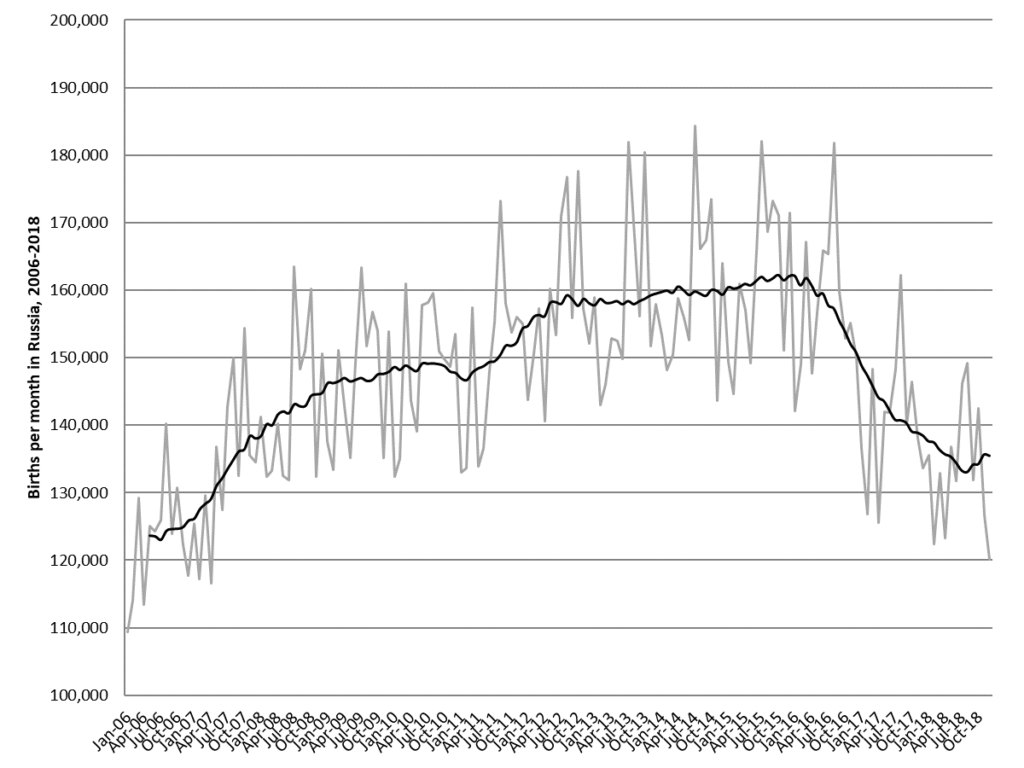
There were about 1,599,316 (10.9/1,000) births in 2018, a decline of 5.4% relative to the 1,689,884 (11.5/1,000) births in 2017. There were about 1,817,710 (12.4/1,000) deaths in 2018, a decline of 0.4% relative to the 1,824,340 (12.4/1,000) deaths in 2017.
Consequently, the rate of natural increase declined from -134,456 (-0.9/1,000) in 2017, to -218,394 in 2018.
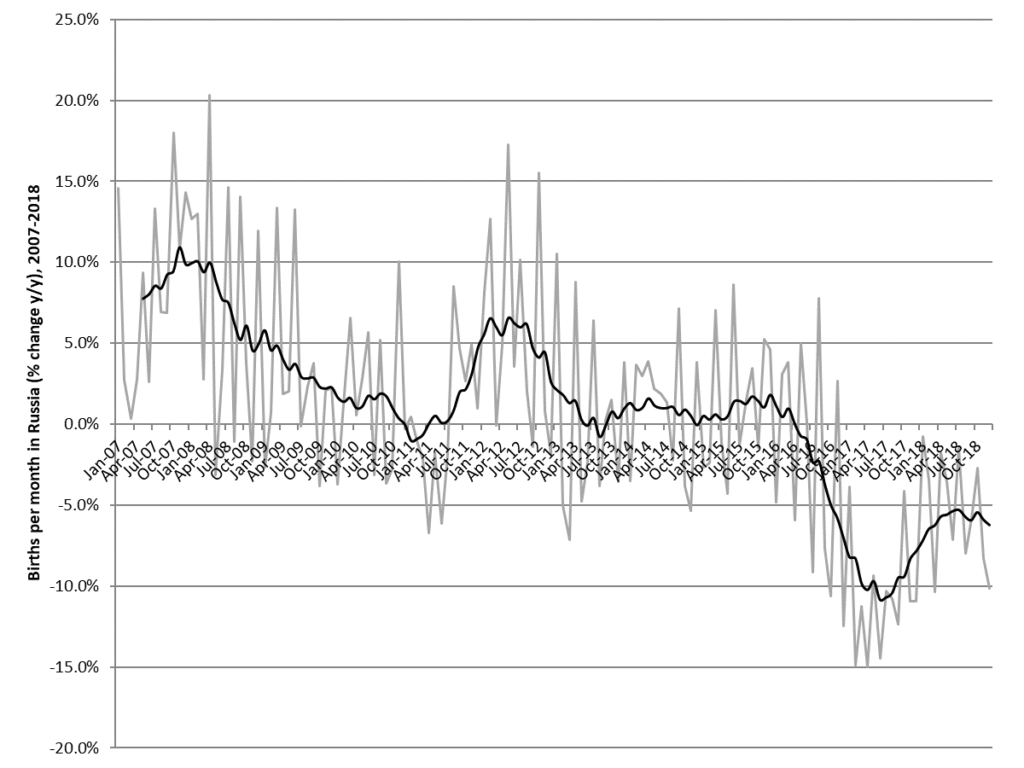
Unlike the previous year, the decline in birth rates was relatively even across Russian and non-Russian regions in 2018 (e.g. Dagestan declined by 5.2%, which is similar to the Russian average).
The population was estimated at 146,793,744 as of Jan 1, 2019, down from 146,880,432 exactly one year ago. This implies about 131,706 in long-term net immigration, down from 172,551 last year.
If accurate, this would mark the first time since 2007 that the population of Russia has declined in absolute terms*.
***
Fertility
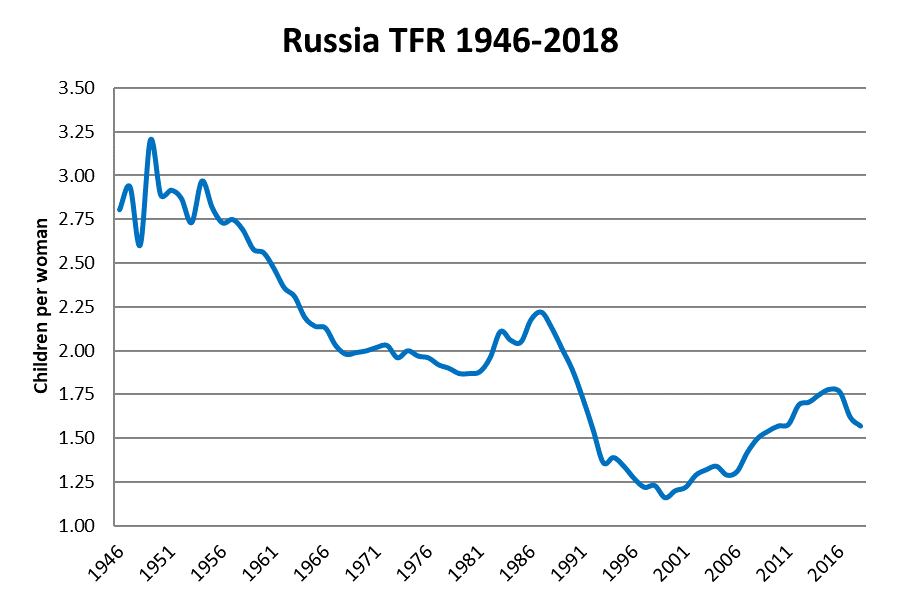
Russia experienced a sustained recovery from the fertility collapse of the 1990s starting from the mid-2000s, during which TFR rose from around 1.3 children per woman to a post-Soviet record of 1.78 children per woman by 2015. However, Russian fertility fell off a cliff in the second half of 2016.
In my last Russia demographic update a year ago, I noted that there were tentative signs that it may have bottomed out in recent months. This turned out not to be, though the rate of decrease did slow down.
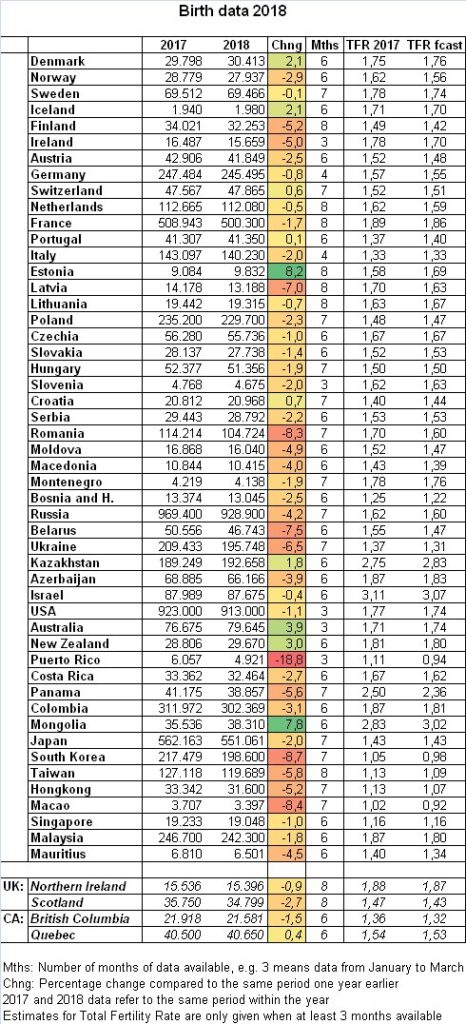
Adjusting for the age structure of the population – the number of Russian women in their childbearing years is falling faster than the number of absolute numbers – I calculate Russian TFR was ~1.57 children per woman in 2018, down from 1.62 in 2017.  (In the previous year, I calculated it would be 1.61 children per woman, while it turned out to be 1.62 children per woman in reality).
I have previously established that ethnic Russians have approximately 0.08 fewer children than the average for the Russian Federation. This would imply that ethnic Russian TFR is now at around 1.5 children per women.
While there’s no way to put a positive spin on these developments, it’s worth bearing in mind that pretty much the entire industrialized world has been in a minor baby glut for the past couple of years (as documented by Twitter demographer @Cicerone1973). Consequently, Russia has largely preserved the relative position to other countries it acquired around 2014-15, at the height of its baby boom. Its numbers are currently very similar to those forecasted for Germany (1.55) and Visegrad (1.47 in Poland; 1.50 in Hungary; 1.53 in Slovakia; 1.67 in Czechia). Note that native German and Visegrad TFRs will also be modestly lower on account of immigrants and Gypsies, respectively.
Broadly speaking, Russia continues to do better than the Med, but worse than France, the UK, Ireland, and Scandinavia. Overall EU fertility in 2016 was 1.60 children per woman, so bearing in mind the decline since then, it should now be in the low 1.50s (with natives at perhaps 1.45 children per woman). American TFR has declined from 1.84 children per woman in 2015 to perhaps 1.74 children per woman in 2018 (translating to a White American fertility rate of ~1.64 children per woman).
I have often made the point that there there seems to be a Great Homogenization, as American millennials adopt European mores while Europeans soak up American culture from Game of Thrones to #MeToo. Despite geopolitical tension, Russia is very much involved in this process as well. It is interesting to see this happening with respect to demographics as well. As we can see, natives/whites in the EU (~1.45), Russia (~1.50), and the US (~1.64) all now have rather similar fertility rates.
A few weeks ago, I wrote a comprehensive article on Russia’s fertility preferences.
While I recommend you check it out and read it in its entirety, one prediction I am willing to make on the basis of that data is that the retreat in Russian TFR observed in 2016-18 will halt, modestly recover, and stabilize at around 1.7 children per woman by the early 2020s.
***
Mortality
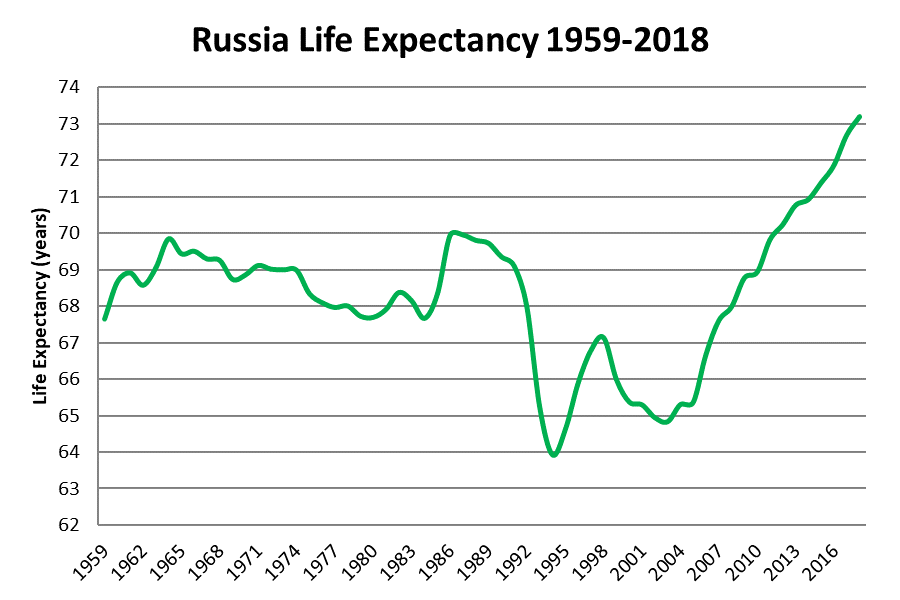
Based on the decrease in mortality, I calculate that life expectancy was ~73.2 years in 2018 (up from 72.7 in 2017), continuing to surge past Soviet-era peaks close to 70 years established in the mid-1960s and late 1980s.
As has usually been the case, this was accompanied by continued strong decreases in deaths from external causes, such as transport accidents, work fatalities, and “deaths from vices.”
This includes deaths from murder, suicide, and deaths from alcohol poisonings, the latter of which drives a great deal of Russian mortality in general.
Given the smoothness of these “Pinkerian” trends, I don’t have much to add beyond what I have said in previous demographic updates.
One way of looking at this is that mortality trends in Russia are basically tracking improvements in the ex-Soviet Baltics (and the City of Moscow) with a lag of ten years, so there is good reason to expect this trend will continue.
This is primarily linked to the big reduction in vodka bingeingduring the past decade, which depressed Russian life expectancy by about a decade relative to what it “should be” based on its GDP per capita and healthcare system. This “alcoholization” began to soar from around 1965, and peaked in the 1990s and early 2000s. According to calculations by the demographer Alexander Nemtsov, something like a third of Russian mortality around 2005 could be attributed to it.
As alcohol abuse fell, so did all of the other components of mortality, especially those most strongly associated with it, i.e. deaths from external causes: which includes homicides, suicides, deaths from transport accidents (despite soaring vehicle ownership), and, self-referentially, deaths from alcohol poisoning.
Part of this reduction was due to cultural change, including the realities of life under capitalism (if you turn up to work drunk, you can be fired, unlike under socialism), part of it was due to economics (more diversity of choice), and part of it was thanks to specific Kremlin policies, such as steady increases in the excise tax on alcohol and restrictions on alcohol advertising.
This year’s update: Moscow’s LE was 77.9 years in 2017, up from 73.3 years – the average Russian LE today – back in 2008. So we could be looking at entrance into the range of developed world life expectancies by the late 2020s.
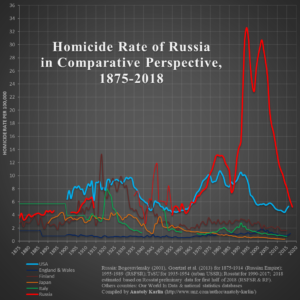
Homicide rates fell from 6.0/100,000 in 2017 to 5.2/100,000 in 2018, returning Russia to its typical historical range before alcoholization epidemic took off in mid-1960s. For anyone who may have missed it, see my post A Short History of Russian Homicides for historical perspective. In that post, I speculated Russia might overtake US in homicide rates in 2018. Not happening because US also had a big drop to ~5.0/100,000. But we can still reasonably expect this to happen in 2019 or 2020 at the very latest.
Based on the experience of Finland – a similarly hard-drinking country that had murder rates similar to those of the Russian Empire at large a century ago, but which in the absence of Communism has come close to converging to the European average – I expect Russia to eventually converge to a homicide rate of 1-2/100,000 one or two decades down the line. For that matter, Moscow – which usually leads Russia on socio-economic trends by around 5-10 years – has already hit that marker, with homicide rates at 1.9/100,000 as of 2018 (it was at Russia’s current level of 5.2/100,000 back in 2010).
Russia is no longer any sort of outlier even amongst developed Western countries in terms of suicide rates.
***
Infant Mortality
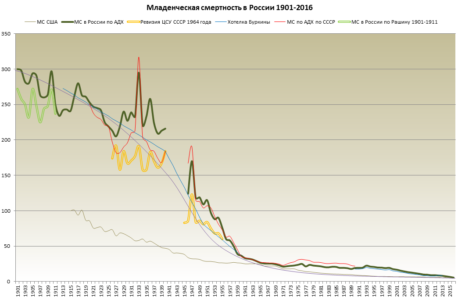
For the historical perspective, see: Russian Infant Mortality, 1900-2016
Having stagnated during the late Soviet Union and 1990s, Russian infant mortality has been rapidly improving ever since, reaching 6.0/1,000 in 2016, 5.5/1,000 in 2017, and 5.1/1,000 this year. Relative to OECD numbers as of 2015, this would actually now put Russia ahead of the US (5.9) and New Zealand (5.7), though most of the rest of the developed world and Visegrad continues to outperform it. It also needs to be acknowledged that the US has more stringent definitions of infant mortality, so in practice it remains ahead of Russia. That said, the gap is now much smaller than it used to be.
Abortion in Russia continues to decline to normal country levels.
This is still about 2-3x higher than in most of Western Europe and the US, but Russia is longer the absolute outlier it once was.
***
The Ukraine & Belorussia
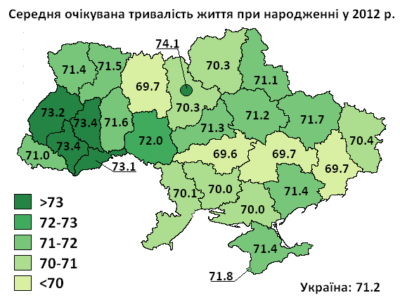
Great Russians have always had lower life expectancies than Ukrainians. This is a remarkably stable pattern since late Imperial times (LE in 1897: Russians – 28.7; Belorussians – 36.2 years; Ukrainians – 38.1 years**).
Except for the last few years…
The crossover point in 2015 at 71.4 years for both. By 2017, Ukrainians were living 72.0 years to 72.7 in Russia, and – considering that there were 10,000 more deaths in the Ukraine in the first months of 2018 relative to the same period last year, while they fell in Russia, this gap will increase further in 2018.
The more Russian/pro-Russian areas of the Ukraine tend to have lower life expectancy than the more Ukrainian/nationalist areas, with the difference between the former and the Ukrainian average constituting about one year.
Consequently, the life expectancy of those regions would now just around 71.0 years. This would now place them at the level of some of the hardest-drinking, lowest LE regions within Russia itself.
The Ukraine is failing in its duty of care to its own people.
This story is repeated across other indicators of public health. For instance, I noted that Crimea had an infant mortality rate of just 3.7/1,000 in 2018, down from 6.9/1,000 in 2013 (its last year in the Ukraine). Ukraine’s rate in 2017: 7.6/1,000, barely down from 8.0/1,000 in 2013. Russia went from 8.2/1,000 in 2013 to 5.1/1,000 last year. Russia’s “annexation” of Crimea has saved thousands of lives.
In terms of fertility rates, the Ukraine peaked in 2012-15 at ~1.5 children per woman, but this collapsed to 1.37 in 2017 and will probably further decline to 1.31 children per woman in 2018. Worst performance in Slavdom.
Belorussia has stopped releasing month to month population data a couple of years ago, so the data we have for it is about a year old. However, it appears to be doing quite well. According to their last demographic yearbook, the TFR was at 1.54 children per woman in 2017 (down from their post-Soviet peak of 1.73 children per woman in 2016; incidentally, this further confirms the general nature of the fertility decline of the past couple of years) and life expectancy was at 74.4 years.
***
Prospects
My “predictions” are pretty basic. Hopefully 2019 will mark a final turnaround in the fertility collapse, though the numbers for late 2018 indicate that we haven’t quite reached bottom yet. Life expectancy, and other health indicators, should continue to improve.
The Russian government recently released its thirteen “national plans” – a massive infrastructure and capacity building program that will plow $400 billion into Russia’s roads, bridges, and hospitals over the next five years.
The two plans most relevant to Russian demographics are the following:
Healthcare ($30 billion)
This program aims to improve mortality from diseases of the circulatory system, dropping it by a quarter. While Russia has seen major improvements on this score (dropping from ~900/100,000 in the early 2000s to 575/100,000 by 2018, it still has a long way to go; typical rates in the EU are well less than 200/100,000.
On the other hand, the goal of lowering infant mortality from 5.5/1,000 in 2017 to 4.5/1,000 by 2024 has already been half achieved (see above).
There is a major emphasis on improving hospital accessibility and prophylactic care.
There’s even a goal of quadrupling medical equipment exports from $250 million to $1 billion annually (while that’s almost a rounding error in terms of Russian exports, this would presumably imply developing a domestic medical equipment industry – could this be a protective measure against the prospect of ramped up US sanctions?).
Demographics ($50 billion)
Goals include increasing healthy life expectancy, increasing the fertility rate to 1.7 children per woman (this would actually fall short of the figures reached in 2013-16; though it does tally with my prediction for the early 2020s), increasing participation in sports.
However, in terms of spending, the vast bulk of the spending – around 90% of it – will go specifically on financial support for families with children and preschooling. There will also be mortgage rates of 6% for families with two or more children.
I looked up the details at RT Russian [Google Translate]:
From January 1, 2019, the amount of state benefits paid in connection with the birth of a child in Russia will increase. Thus, the maximum amount of monthly payments to parents whose children have not reached 1.5 years will exceed 26 thousand rubles, the minimum – 4.5 thousand rubles. At the same time, the maximum amount of maternity allowance will exceed the level of 300 thousand rubles. For at least 140 days of maternity leave, the mother will be able to get 51.9 thousand. Assistance is provided for both employed parents and unemployed. Earlier, Russian President Vladimir Putin said that the total funding of measures to support families with children in the next six years will amount to almost 2.7 trillion rubles. …
This type of assistance from the state is more designed for employed parents, since the amount of the benefit should be 40% of the average earnings for the two previous calendar years per one month. The marginal bases for calculating insurance contributions to the Social Insurance Fund for 2017 and 2018 are 755 thousand rubles and 815 thousand rubles.
Essentially, this represents an intensification of the pro-natalist policies that Russia has been pursuing for a decade now. This seems similar to trends in Hungary. Let’s see if it works.
***
* In reality, I suspect not, because immigration is usually underestimated. Russia’s population increased substantially after the 2010 Census, necessitating post hoc adjustments.
** Boris Mironov. Российская Империя: От Tрадиции к Mодерну, том I. pp. 283.


