Originally appeared at ZeroHedge
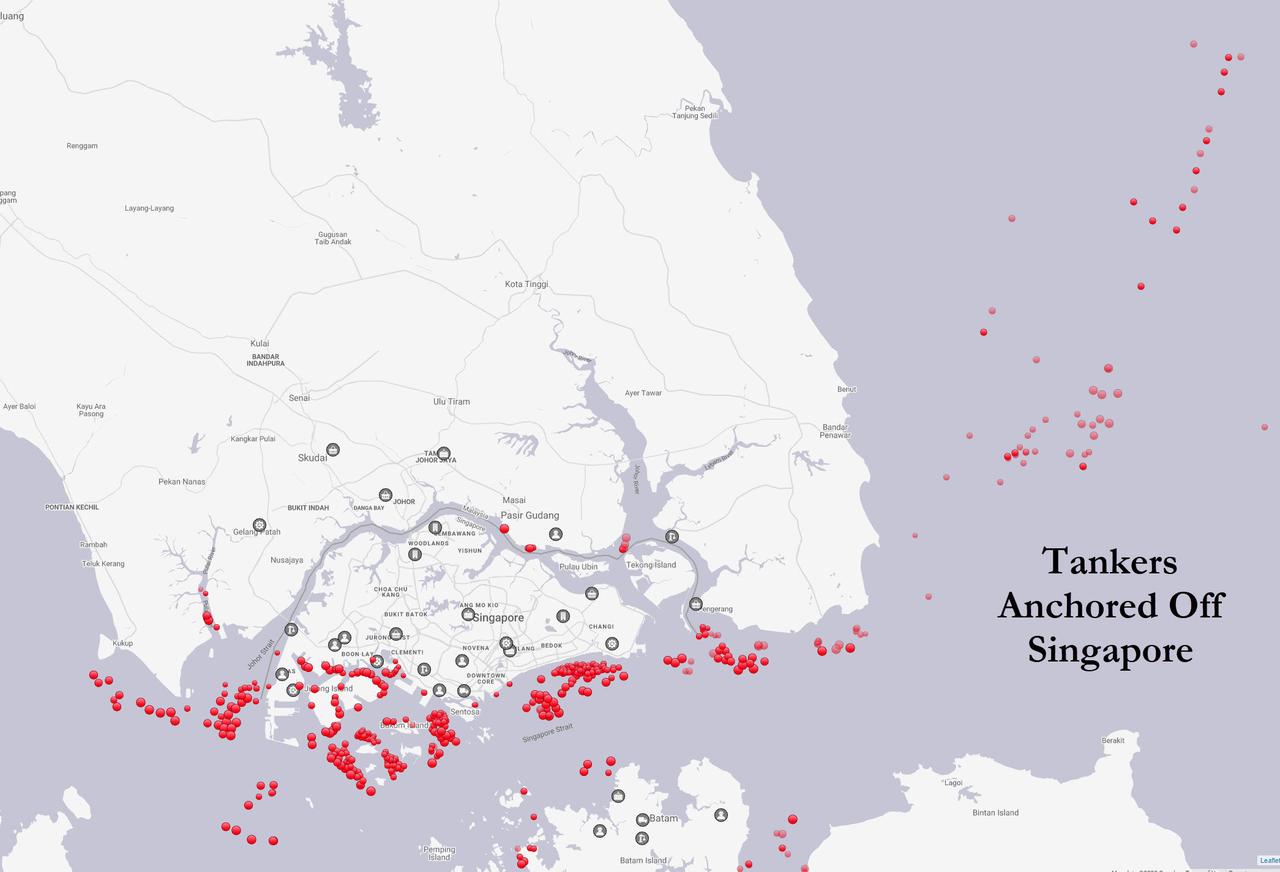
Last weekend we showed that as oil storage on land was rapidly filling up, a familiar sight was seen off the coast of Asia’s oil hub in Singapore: a record surge in tankers on anchor used as seaborne storage, and taking advantage of the supercontango just waiting for oil prices to rebound so they can deliver their (formerly) precious cargo.
So as more and more storage moves offshore, here is an update from Bank of America on the current status of the oil market as the “oil glut moves from tanks to tankers.”
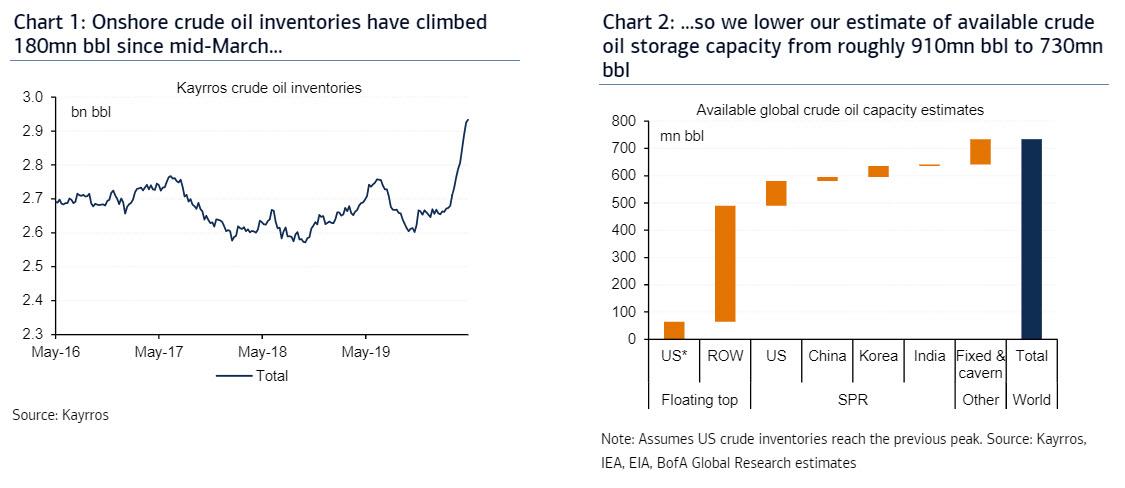
In the last five weeks, onshore inventories held in floating top tanks climbed 180mn bbl, suggesting that builds have averaged roughly 4.3mn b/d since mid-March. These inventory increases reduce BofA’s estimates for available onshore crude storage capacity from roughly 910mn bbl to 730 mn bbl (Chart 2), although the bank still believes that this capacity is unlikely to be fully utilized due to logistical constraints and other issues.
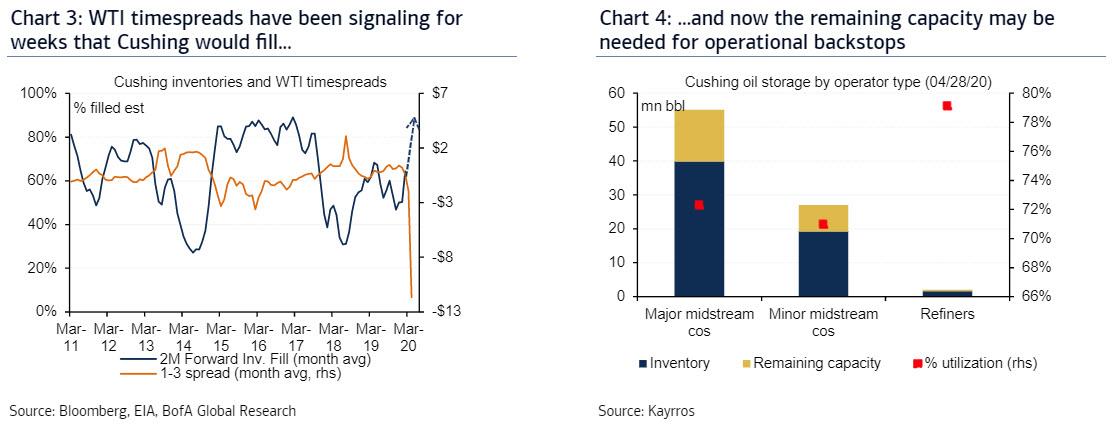
How did we get here? As has been extensively reported here and elsewhere, WTI timespreads signalled a massive build in Cushing inventories and stocks would likely reach their operational limits within a few weeks (Chart 3). More recently, the expiration of the May WTI contract demonstrated the lack of available capacity at the hub. Cushing inventory builds are set to slow dramatically as much of the remaining capacity may be needed as an operational backstop for pipeline issues and blending needs (Chart 4). Over the coming weeks and months, US inventory trends could even reverse as producers in Canada and the Bakken shut-in output and refiners increase runs on the back of the re-opening of the economy.
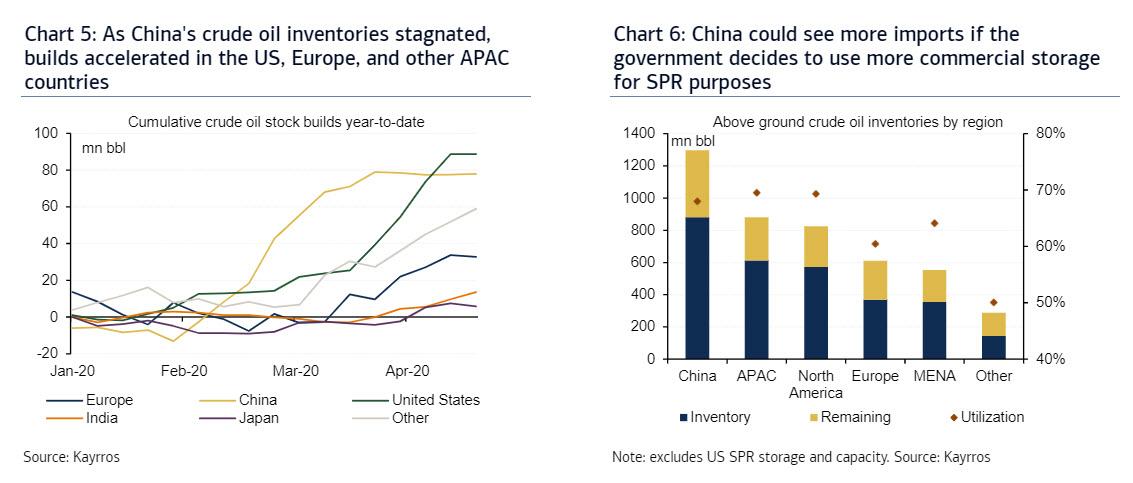
As Bank of America adds, land based crude oil inventories first surged in China, where the coronavirus outbreak originated (Chart 5). Since then, China’s inventories have stagnated while stocks in the US and elsewhere ticked higher. There is room for incremental builds in China going forward, especially if the government uses more commercial tank space for strategic petroleum reserves (Chart 6). Elsewhere, inventories in Europe and the Middle East remain relatively lower. In Europe, this may be due to the mothballing of some tank storage at refiners and terminals. So, actual storage utilization rates may be higher than the data suggests. In the Middle East, inventories have climbed in GCC countries but may also remain lower on average as these countries prefer to sell oil as exports before storing domestically. In the US, producers have leased 23mn bbl of the roughly 70mn bbl of available SPR capacity and added 1.1mn bbl to SPR storage last week.
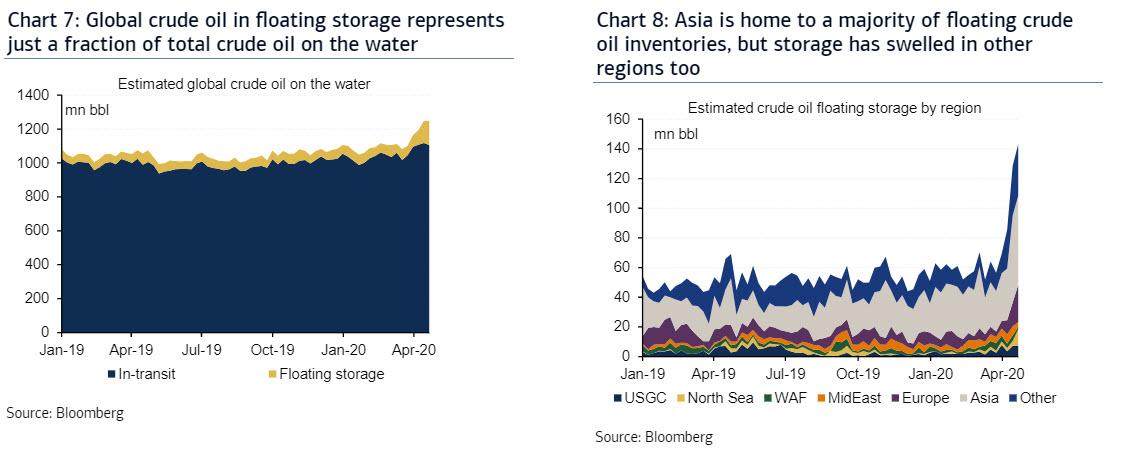
Of course, in addition to land based storage, the market also uses tankers for crude oil storage as a spillover outlet. Crude oil on the water has risen by roughly 150mn bbl since the start of the year, to more than 1.2bn bbl (Chart 7). This is due to a combination of higher crude in transit stemming from OPEC’s oil price war and from increases in crude oil floating storage. Since mid-March, crude oil floating storage has grown by an estimated 91mn bbl, or roughly 2.2mn b/d (Chart 8). Asia and Europe saw the largest increases in floating storage, climbing 36mn bbl and 20mn bbl respectively over the same period.
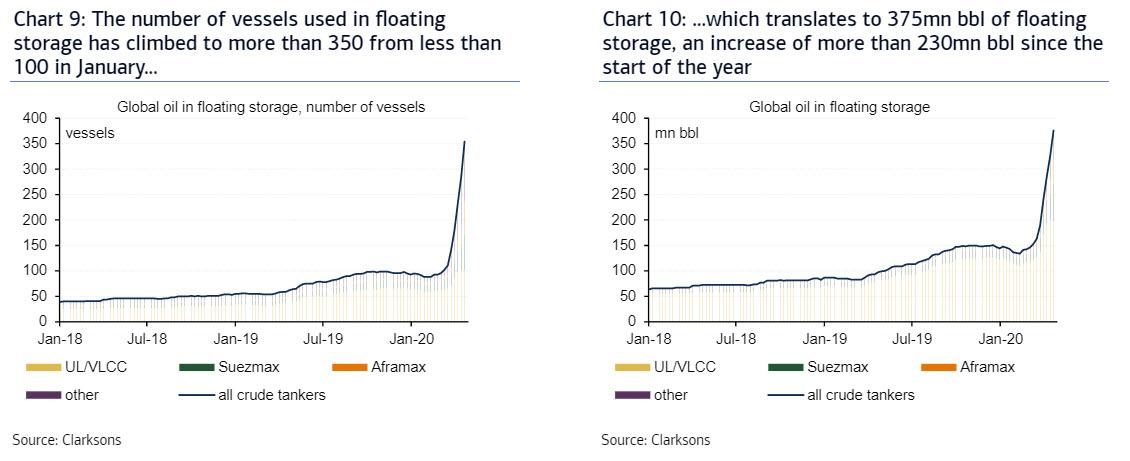
According to data from Clarksons, there are more than 350 vessels currently being used for floating oil (crude and product) storage globally (Chart 9). Of this total, roughly 100 are very large crude carriers (VLCC) and ultra-large crude carriers (ULCC). Total oil held in floating storage has risen to 375mn bbl, up 220mn bbl from mid-March and 230mn bbl from the start of the year (Chart 10). A majority of this storage has occurred on VLCCs and ULCCs, followed by Suezmax and Aframax vessels.
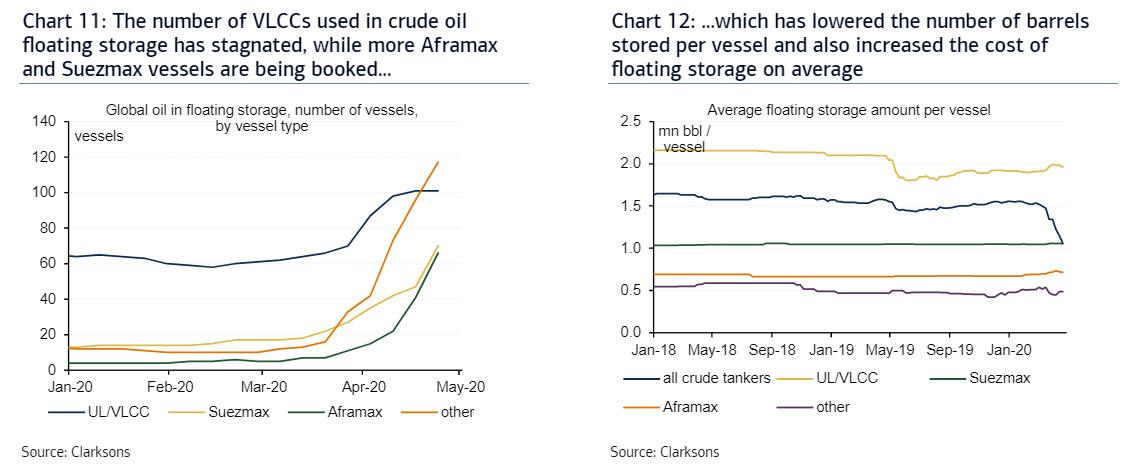
The first vessels booked for floating storage were primarily VLCCs and ULCCs, but demand for Suezmax and Aframax vessels has also increased dramatically since April (Chart 11). As traders utilize more of the smaller vessels, the average amount of floating storage per vessel has decreased, implying an increase in the average cost for floating storage. Since the beginning of the year, the average level of storage per vessel have collapsed from more than 1.5mn bbl to just 1mn bbl. (Chart 12). This rise in tanker rates for each ship type, combined with crude increasingly being stored on smaller vessels at the margin, is a double positive whammy on the marginal cost of crude storage and thus on the contango in the crude curves.
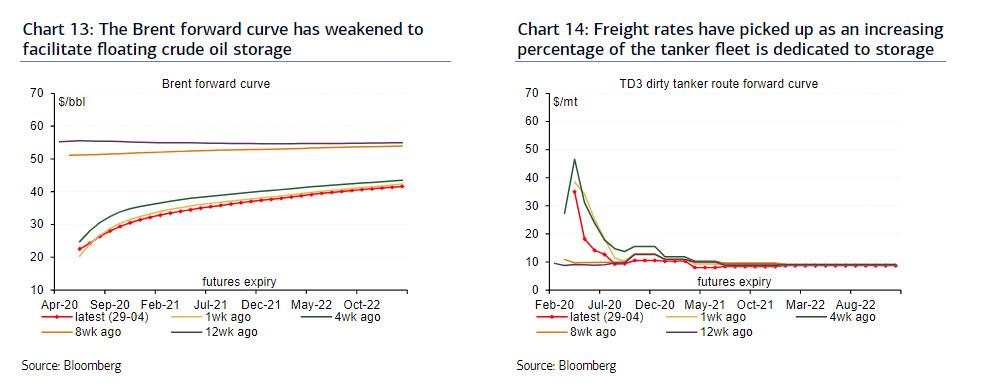
The abrupt demand contraction has forced crude oil forward curves into steep contango (Chart 13), with Brent 1-13 spreads widening to -$16/bbl at times to facilitate floating storage. As demand for freight picked up, dirty tanker rates spiked. The shape of the forward curve for the TD3 dirty tanker route (Middle East to Japan) was very flat just eight weeks ago (Chart 14), but the increase in demand from Saudi Arabia and from floating storage pushed front month rates up nearly 400%. More recently, rates have subsided somewhat but still remain exceptionally high compared to historical levels.
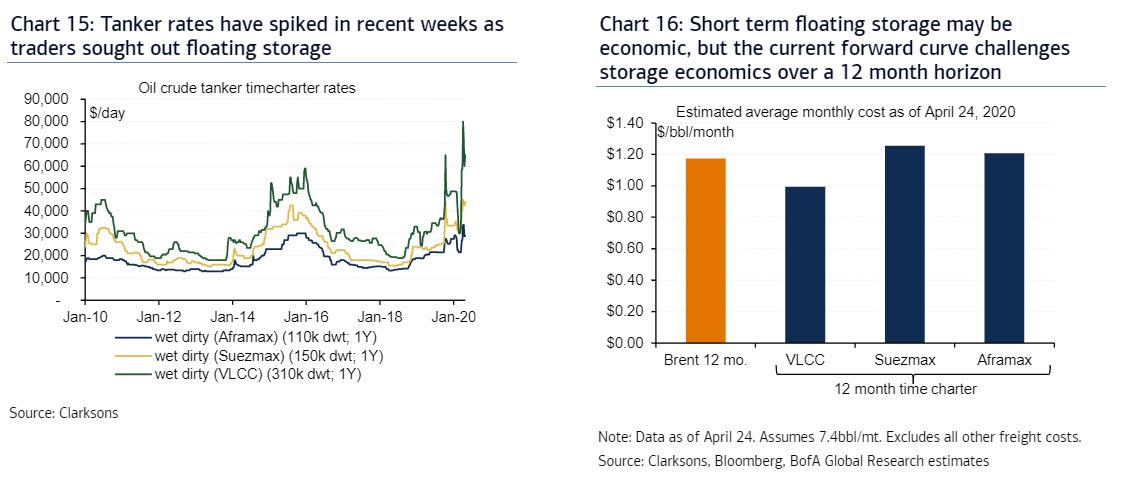
Freight rates have been exceptionally volatile, with VLCC 12 month time charters spiking to $80,000/day in early April and falling to around $65,000/day recently (Chart 15). The increase in smaller vessels has been less dramatic, with Suezmax and Aframax vessels peaking at $45,000/day and $34,000/day respectively. The very steep contango in the front of the Brent curve (e.g. 1-3m) has allowed for floating storage to be economical. Yet the 12 month contango in Brent was recently lower than the going rate for 12 month time charters for Suezmax and Aframax vessels. Additional pressure on Brent timespreads will be needed in order to encourage more floating storage using these types of vessels (Chart 16).
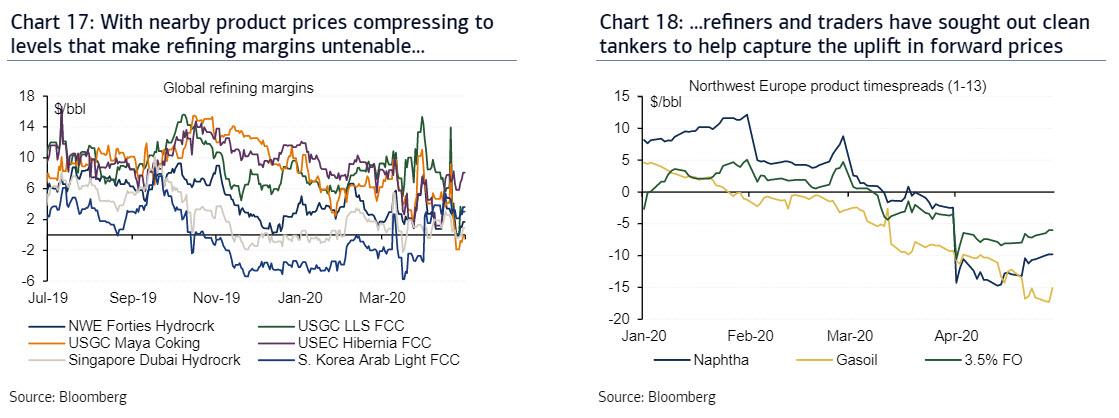
Refining margins have been exceptionally volatile since lockdowns began on a global scale (Chart 17). As refiners cut runs or shut down completely, margins experienced short term rebounds, but margins continue to trend towards zero on a spot basis as refined product inventories surge. In the US, product inventories have risen counter-seasonally and are now nearly 70mn bbl above year ago levels and 26mn bbl above previous five-year highs from 2016. It is no surprise that refined product markets have also developed their own supercontango (Chart 18), as prompt prices plummeted. Refiners have attempted to take advantage of the significant price improvement for forward product prices by storing products on land on and the water.
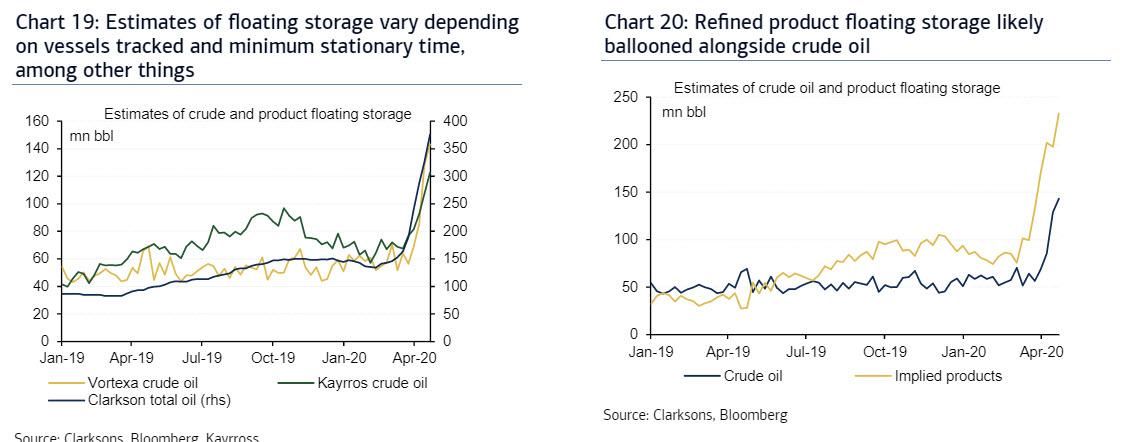
Estimates for floating storage vary depending on methodology. Some trackers classify floating storage as vessels that have remained idle for 10 days and others assume 14 days. The types of vessels tracked may also vary, leading to higher or lower floating storage levels. Nonetheless, all estimates point to rising volume on the water (Chart 19). Refined product floating storage is not well tracked, but Clarksons does track total tankers used for floating storage. Combining Clarksons data with other crude oil only floating storage data from Vortexa implies that refined product builds have been exceptional (Chart 20). Even if total levels of implied refined product floating storage are off, there is little doubt that product storage is on the rise.
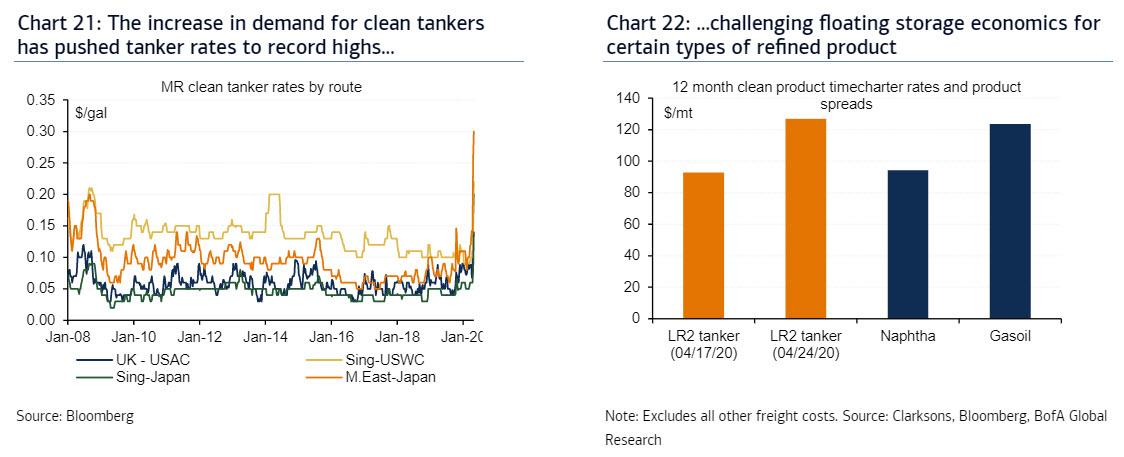
The oil surplus was initially visible in dirty tanker freight rates, but clean tanker rates are now beginning to surge as refiners and traders seek to float unsold product volumes (Chart 21). With refined product prices like Singapore gasoline falling to $0.50/gal, shipping has become a disproportionately large component of the all-in cost of delivered fuel, making fuel movements exceptionally expensive. The economics for floating product storage varies dramatically depending on the contango of each product market and on the density of individual products. The recent surge in clean product tanker rates has challenged floating storage economics (Chart 22), but volatility in product forward curves should continue to offer opportunities for traders to float cargoes.
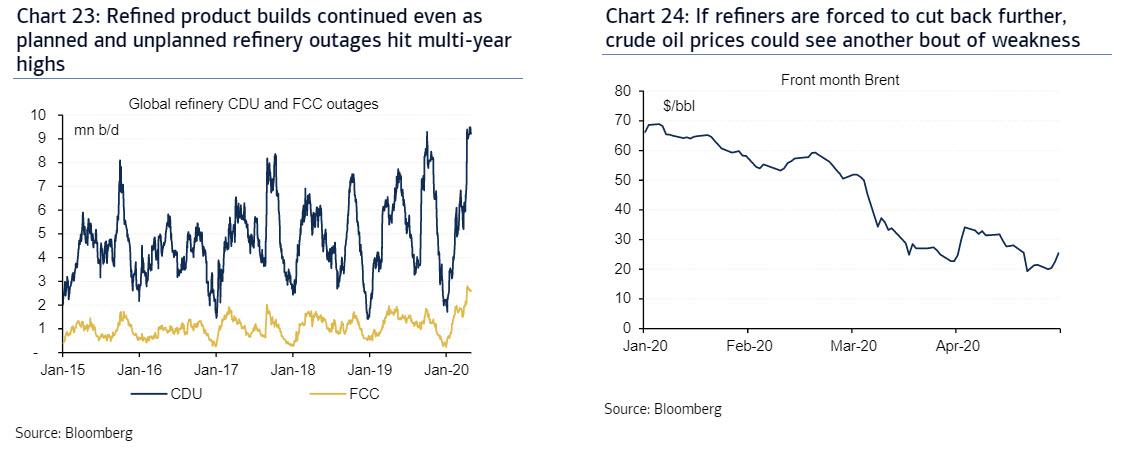
Another round of run cuts could bring renewed crude weakness. The global oil rout likely peaked in April as oil demand contracted by nearly 25mn b/d YoY. Now, countries are emerging from lockdown, boosting oil demand just when OPEC+ cuts are kicking in and producers elsewhere are cutting output. Even so, the market should remain in surplus for the remainder of 2Q20, resulting in continued, albeit slower crude oil and product builds. The oil market is forward looking and market balances look much better in 2H20 which should be supporting of prices. That said, with so much product moving into floating storage, we see risk of additional pressure on refining margins, even as global refinery outages hit record levels (Chart 23). Any further reduction in refinery demand for crude could ultimately result in renewed weakness for crude oil prices (Chart 24) and would likely warrant steeper contango.




All these heavy tankers full of oil will cause water displacement and flood low lying coastal areas…joking bwahahaha
375mb is about 5 days consumption at the assumed level of 75mb/d and about 3,75 at pre-corona level. problem using a vessel for storage is the cost compensation to the ship owner and it’s not at the usual demurrage rate but much heftier but since interest rates are close to zero and if the contango is say 15 bucks means thatthe profit to be made for a suezmax vessel or about 1mb the profit would be just that 15m bucks and from that to be deducted freigh, demurrage, interest etc. so if the demurrage is say 4m bucks for a period of 60 days, the cargo owner still stand to make a nice profit. which can change if the corona level of consumption drags out and the producers don’t cut more on the output. will be fun to watch.
And what if the oil owner wouldn’t be able to sell his oil at convenient price?
the more unsold oil the quicker will the production of further volumes be reduced – of course this could be a lengthy process but it will happen and a point will be reached where the ship-stored stuff will be sold. I guess saudi and the emirates are sitting on a majority of this oil and will absorb the losses if and when it is unavoidable and after all most of these cargoes were shipped when the prices were at say 12 bucks per barrel and is today at 21 bucks per barrel. so the market is moving favourably for mbs, it would seem.
I wonder if an oil spill could be used as a justification for increased US naval patrols?